The “Value” of Propaganda: Machine Predictions of Rare Events Based on Text Data

Protesters in Hong Kong gather in opposition to the Chinese extradition bill on June 12, 2019. Photo by Studio Incendo.
By Julian TszKin Chan and Weifeng Zhong
Introduction
One of the virtues of good theory in international relations is to be able to assist policymakers in anticipating future developments.[1] This is ever more important in the era of great power competition between the United States, China, Russia, and other powerful states. But what makes it particularly relevant also creates a distinct challenge: great power competition on a geopolitical scale is rare, and making good predictions of rare events is difficult.
Take China as an example: it is the only socialist country in history that, while remaining authoritarian, has abandoned central planning and grown its economy to one of the world’s largest. As a result of this uniqueness, there are not enough comparable precedents to draw statistical inferences about China’s major policy moves.[2] Will President Xi Jinping’s administration enact more or less pro-market reforms? Will China concede to U.S. demands in their ongoing trade fight? Will the 2019 Hong Kong protests, which are ongoing at the time of this writing and have, at times, turned violent, face a Tiananmen-like crackdown by the Chinese government? The conventional toolkits used by political scientists are not adequate for answering specific, near-term questions of this nature.[3] Additionally the domestic and international politics of these events are intertwined, further complicating the challenges of predicting future developments.
In this article, we employ a new approach hinging on machine learning to tackle these prediction problems. We start from an assumption that propaganda is an effective tool for moving public opinion and is therefore of indispensable policy value to authoritarian regimes.[4] Changes in propaganda content, therefore, often precede changes in actual policies. While fundamental socio-economic factors that drive policy changes may be too complex to sort out, natural language processing techniques can help us detect early warning signs in propaganda before policy changes take place.
In the context of China, we have conducted two studies that attempt to predict the Chinese government’s next moves by analyzing its official newspaper, The People’s Daily. The only input in these studies is the full text of the newspaper from when it was established in 1946 to the present day.
In the first study, we attempt to predict, on a quarterly basis, changes in China’s policy priorities by detecting changes in The People’s Daily’s editorial emphasis. The predictive algorithm has important implications for the U.S.-China trade negotiations. The second study tries to predict, on a daily basis, if and when the Chinese government will crack down on Hong Kong protesters. The assessment is made by comparing how closely The People’s Daily’s narrative regarding the ongoing Hong Kong protests resembles that regarding the Tiananmen protests.
While our studies have focused on China thus far, the machine learning framework is by no means only applicable to this context. We end this article with a discussion on how this method can be applied to a variety of other situations around the globe.
The “value” of propaganda
Government propaganda in authoritarian regimes is commonly criticized, rightfully, for containing biases and disinformation and failing to meet modern standards of journalistic integrity. For this reason, researchers often avoid utilizing propaganda as a reliable source of information about a country of interest. However, it would be misguided to dismiss the value of propaganda in gleaning information about an authoritarian regime. In fact, propaganda content is exceptionally informative—not of the factual world, but of the authoritarian regime’s own views and intentions.
One example is the Soviet propaganda system. In the earlier years of the USSR, Vladimir Lenin asserted that “the whole task of the Communists is to be able to convince the backward elements.”[5] To fulfill that mission, he considered it a fundamental necessity “to transform the press from an organ which primarily reports the political news of the day into a serious organ for the economic education of the mass of the population.”[6] Josef Stalin further elaborated that the purpose of such “economic education” is to “convince the masses by their own experience that [the party’s] policy is sound, thus ensuring the support of the working class and inducing the broad masses of the workers to follow [the party’s] lead.”[7] In short, the regime relied on propaganda heavily to move public opinion ahead of policy so that subsequent economic policies could move forward with minimal resistance.
The Soviet propaganda model has been followed by China from its inception in 1949 through the modern era. As the literature on China’s propaganda system has shown, despite the transformation in the late 1970s from central planning to market economy, the Leninist model of indoctrination and mass mobilization remains quintessential in China’ political order.[8] More recently, in 2016, President Xi Jinping made a high-profile visit to three major state news organizations and reiterated the role of China’s official media most explicitly: “all news media run by the party must work to speak for the party’s will and its propositions, and protect the party’s authority and unity.”[9]
Because of a regime’s need to prepare the public for what is to come, a method that detects changes in propaganda content would be, effectively, a method that predicts changes in upcoming policies.[10] This is the methodology underlying the series of Policy Change Index (PCI) projects, which we will describe in subsequent sections.
This approach is agnostic to the socio-economic factors that drive the changes in policies; those factors are traditionally at the center of social science research but are frequently too complex for generating specific predictions. Instead, we attempt to detect early warning signals of those changes in the regime’s own words—words that are typically observed just before the changes take place.
One analogy in macroeconomics is the inverted yield curve. Many economists believe that the yield curve tends to invert when a recession is afoot, making it a near-term leading indicator. While the fundamental causes of a recession may be complex, detecting an inversion of the yield curve, as a near-term forecasting exercise, does not require understanding those fundamental causes. Similarly, in this approach to predicting policy changes, the exact socio-economic drivers of the changes are not essential to making the predictions.
Policy Change Index for China [11]
China scholars tend to focus their attention on the Chinese economy and the government’s prominent role in driving the national industrialization process. While there are voluminous data on the Chinese economy, until now there have been no quantitative indicators of the Chinese government’s policy priorities over a long period of time.[12]
In the first study, we fill that gap by devising the first of such measures, the Policy Change Index for China (PCI-China hereafter), a predictive indicator of major policy moves from the first quarter of 1951 to the third quarter of 2019, and it will be updated on a quarterly basis in the future.[13] This indicator not only helps us understand China’s industrialization process in the past but also allows us to make short-term predictions about its future.
As elaborated in the previous section, we approach the problem of predicting changes in policy priorities by detecting changes in The People’s Daily’s editorial emphasis. Since editorial emphasis is an abstract concept, we proxy for it using a front-page classifier that predicts whether an article appears on the front page—the most prominent space in a newspaper—based on the text of articles in a certain period.[14]
Figure 1 outlines the method of constructing the PCI-China. For each five-year window, we build a front-page classifier to read the text of the articles published within that time and learn to tell front-page articles apart.[15] Whatever patterns the algorithm learns in this step would constitute a fairly good understanding of the editorial emphasis during the five years in question. We then deploy the same front-page classifier to the quarter following the five-year window and examine how the performance is. If the editorial emphasis is more or less the same, the algorithm should perform just as well in the new quarter as it did in the previous five years. But if the performance is very different, it would mean the editorial emphasis has changed from the preceding five years to the next quarter. After all, the editorial emphasis is fundamentally a reflection of what the government-controlled editors consider worthy of front-page status, and, implicitly, which content is not so deserving.

Figure 1: Outline of PCI-China algorithm
We define the difference in performance between the two classification tasks—the one for the five-year period and the one for the following quarter—as the PCI-China (for that particular quarter). When the indicator’s value is close to zero, it means the two classification tasks are performing similarly, indicating a stable editorial emphasis. In contrast, if the indicator’s value is high, it suggests a shift in editorial emphasis.
Finally, to produce a time series, we move the training period quarter by quarter, generating a quarterly indicator from the first quarter of 1951 to the present.
Figure 2 shows the PCI-China together with the set of events that academic researchers generally consider important in the history of the Chinese economy in the modern era.[16] For an indicator to be predictive in this context, it would have to have two properties: (1) in terms of timing, it should spike up before an actual policy change occurs; and (2) in terms of substance, since a spike represents different classification performance between the quarter in question and the previous five years, the content of the articles misclassified by the algorithm should be consistent with the nature of the actual policy change preceded by the spike. In other words, if the indicator spikes up before the government changes policy A to policy B, and if the misclassified articles around the spike correspond to a shift from topics related to policy A to that related to policy B, then the indicator is considered predictive of that particular policy change. As the figure shows, the PCI-China typically precedes the labeled major events.[17] Moreover, as we have demonstrated in our earlier writings, the substance of those spikes is consistent with the policy changes they precede.[18]
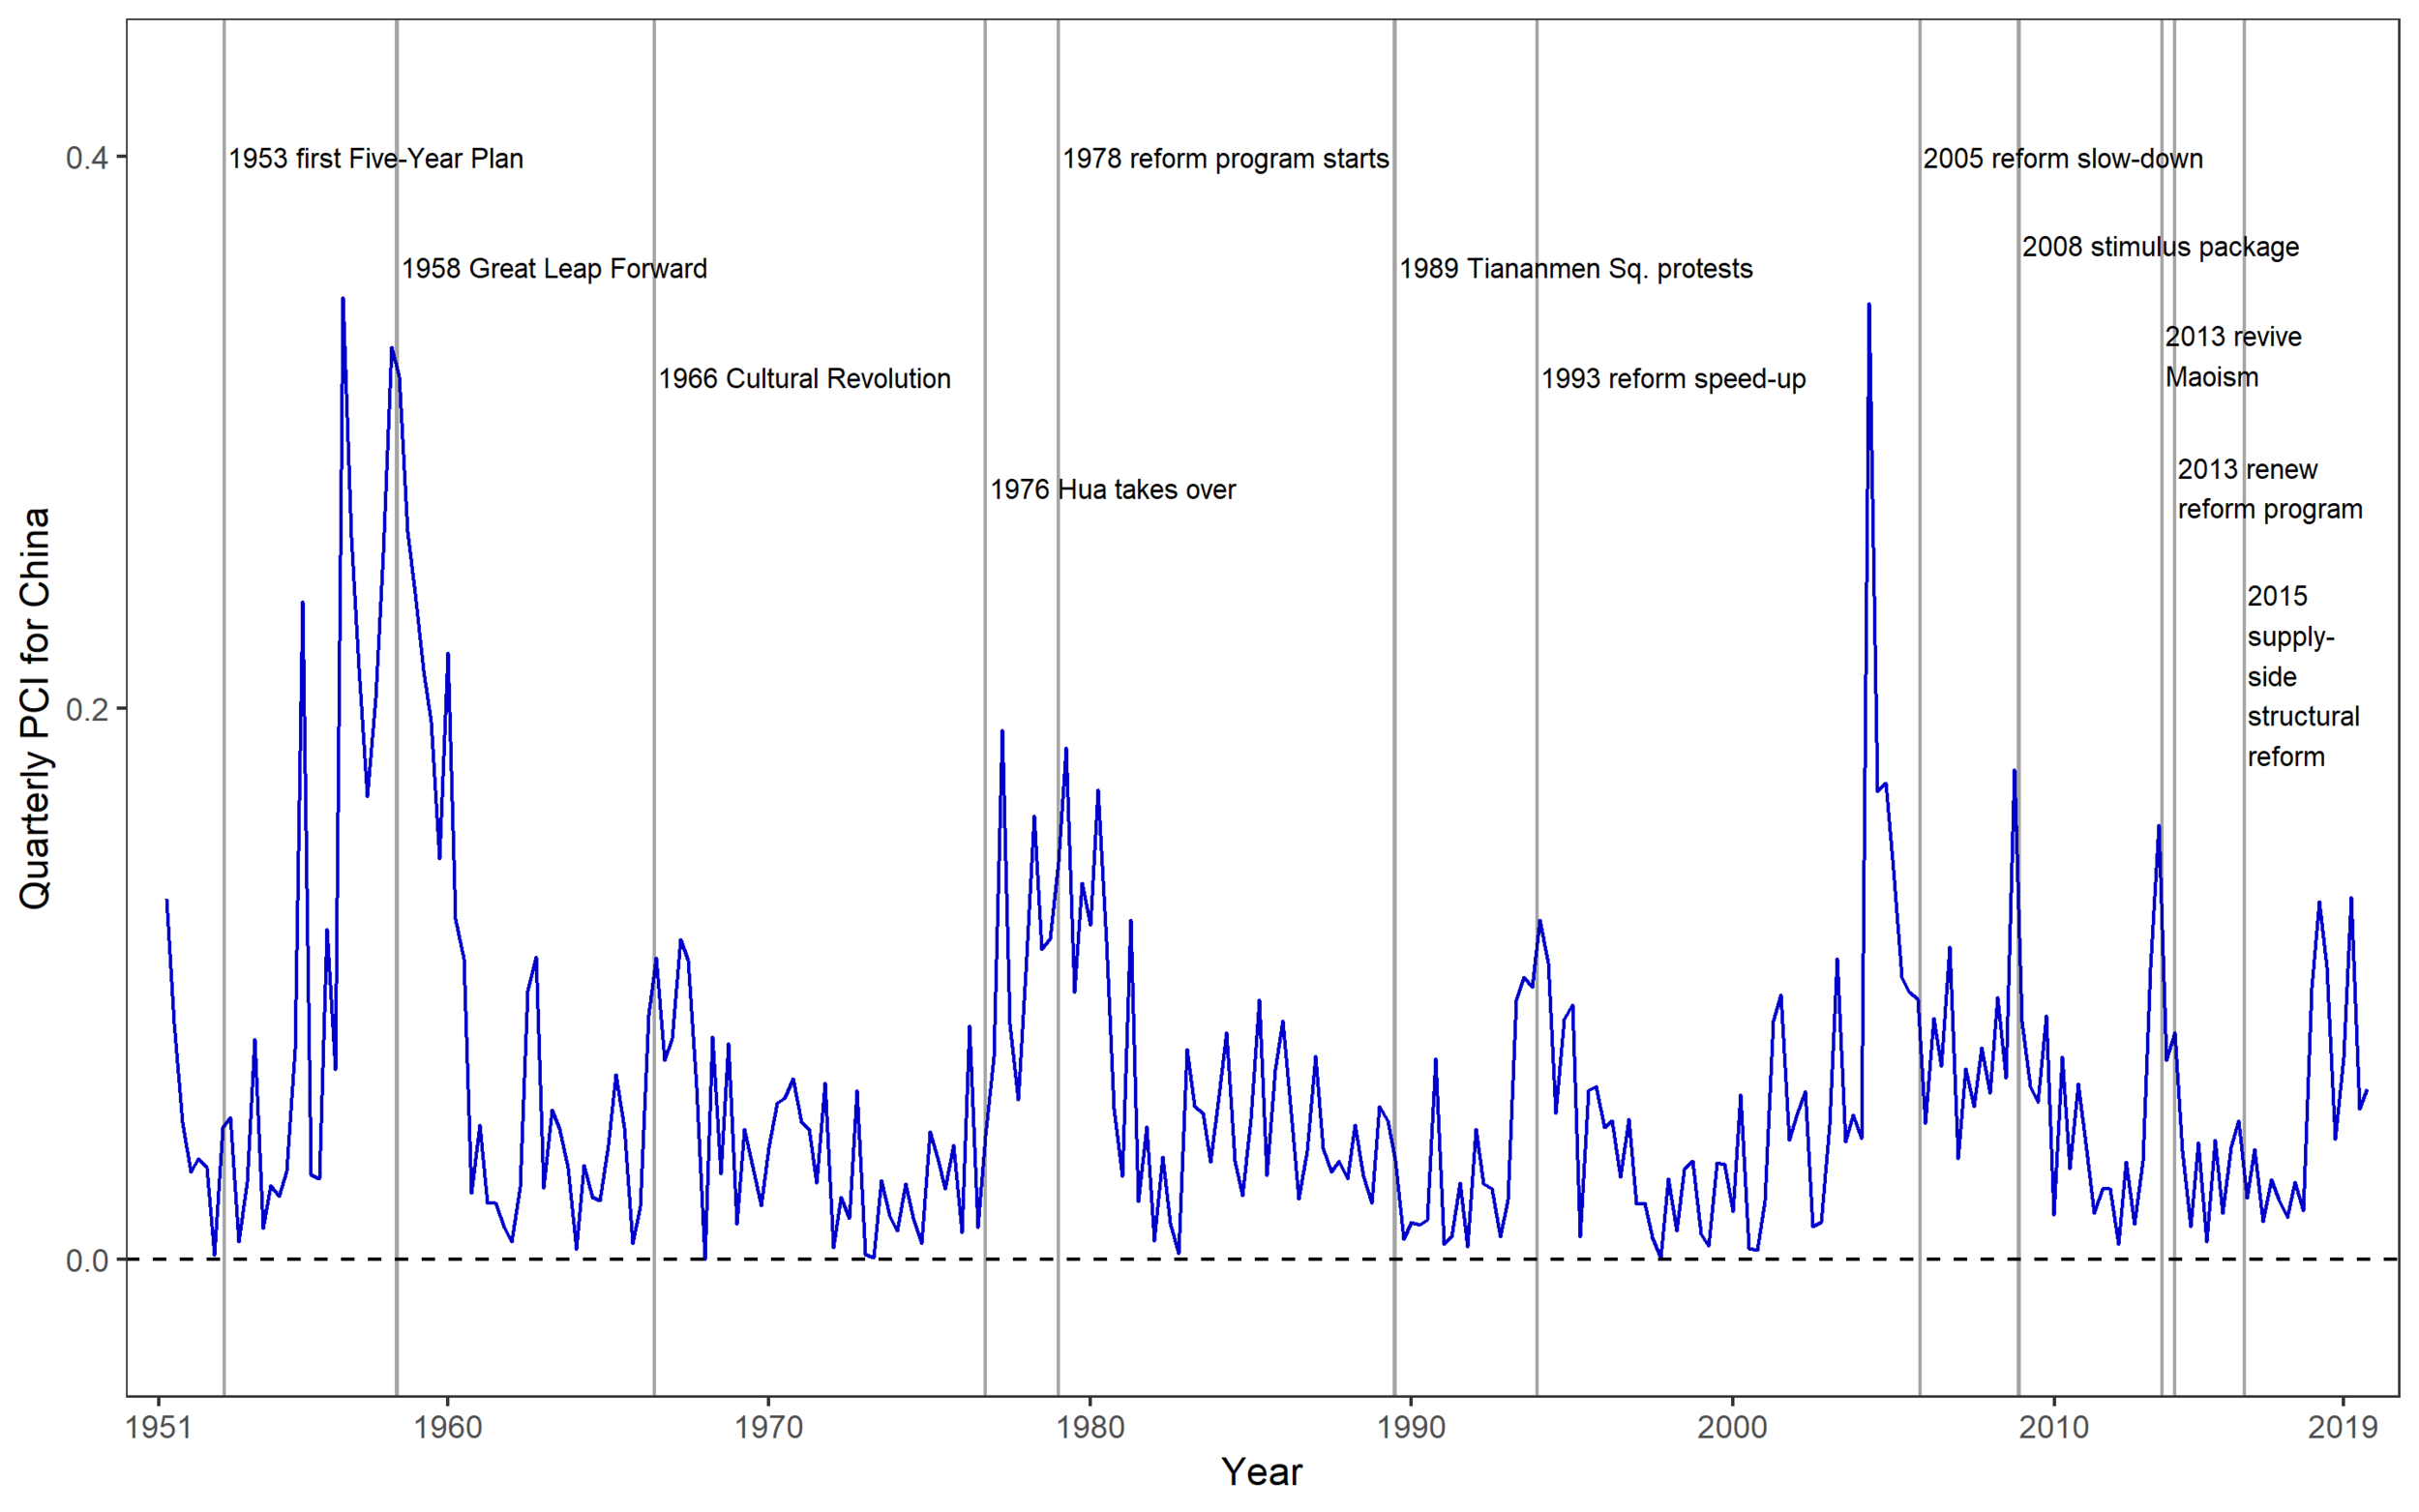
Figure 2: PCI-China and major policy events
A good example is the 2005 reform slow-down under former President Hu Jintao, largely attributed to his “Harmonious Society” initiative. This policy change is picked up by the indicator in 2004—five quarters ahead of time. Figure 3 provides a zoomed-in view around that time. At the time of the 2004 spike, the articles misclassified by the algorithm represent a shift away from prioritizing pro-market reforms, such as privatizing state-owned enterprises and allowing private companies wider and fairer access to various sectors in the economy, to an emphasis on tackling a set of social issues, such as income inequality, poverty, and regional imbalance in development, with interventionist government measures. These latter policies would be consistent with government interventions that undermine the role of the market in allocating resources, which is what did occur the next year with the “Harmonious Society” initiative.

Figure 3: PCI-China and major policy events, 1997 Q1 to 2007 Q4
The tool also has important implications for the ongoing U.S.-China trade fight. The indicator shows two recent upticks, in the first quarter of 2018 and, subsequently, the first quarter of 2019. In both cases, the editorial changes suggest that China is taking increasingly stringent positions in domestic issues and foreign policy. The newspaper coverage emphasizes, even more than before, the importance of state-owned enterprises and using interventionist measures to boost the economy, and it argues for taking a leadership position on the global stage.
As we have written elsewhere, this editorial emphasis is inconsistent with U.S. demands in the trade negotiations, namely, that China reduce the role of government in its economy.[19] Using the indicator, we have predicted consistently since the beginning of the year that China will not agree to making such changes as part of a trade deal with the U.S. What has transpired so far has been in line with our prediction.
Policy Change Index for Crackdown [20]
The year 2019 saw a series of protests in Hong Kong that persisted to the time of this writing, stirring anti-China sentiment and spurring speculation of a Tiananmen-like crackdown by the Chinese government on the semi-autonomous city.[21]
In the second study, we attempt to predict if and when such a crackdown will occur using a method similar to the PCI-China. The output, which we call the Policy Change Index for Crackdown (PCI-Crackdown hereafter), gives a daily estimate of how close in time the 2019 Hong Kong protests are to the Tiananmen crackdown in 1989. The closer the PCI-Crackdown’s output is to June 4, 1989, the more likely a similar crackdown will happen in Hong Kong as well.
Two challenges stand out in predicting the occurrence of such a crackdown: (1) the protests and the government’s responses to them are highly interactive, and (2) a Tiananmen-like crackdown is a particularly rare event; it only happened once before in China.
To overcome these challenges, we rely on the same hypothesis as before—propaganda precedes actions. The idea is, even though authoritarian regimes do not have free and fair elections, public opinion still matters to the government, especially regarding such contentious, destructive policies as a crackdown. In the days leading up to the June 4, 1989 crackdown on Tiananmen protesters, The People’s Daily drastically changed its rhetoric on the protests. “Demonstrators” and “protesters” became “rioters,” and the students, who used to “have a good heart,” now only wanted to “destroy the country’s future.” As described earlier, we believe that the Chinese government’s playbook in this regard has not changed since 1989, and that the same approach applies to the case of Hong Kong: if the Chinese government were to crack down on the protests, it would also change its narrative of the protesters in order to prime public opinion to support government action. Our machine learning program is built to detect such a narrative change.
Figure 4 shows the method of constructing the PCI-Crackdown, which is similar to that shown in Figure 2. We first train a date classifier that predicts the date of publication for an article using the text of People’s Daily articles in 1989 that are related to the Tiananmen protests. We use the same learning-from-examples approach, except that, here, instead of the algorithm learning what kind of text appears in articles on the front page, it learns what kind of text appears in articles on each date leading up to the Tiananmen crackdown. After training the algorithm, we feed it the recent articles on the Hong Kong protests and ask it to determine the predicted dates for the new articles. Because the model was trained using articles from 1989, it will likely make “mistakes” when processing articles published in the present day, predicting that they are from 1989 as well. But this error is exactly what we aim for: each (factual) date in the Hong Kong protest timeline is cast back—by “mistake”—to the Tiananmen timeline, and the counterfactual date assigned to that (factual) date is defined as the PCI-Crackdown for the Hong Kong protests on that day.

Figure 4: Outline of PCI-Crackdown algorithm
Figure 5 shows the PCI-Crackdown for the 2019 Hong Kong protests as well as a set of events related to the protests that indicate the change in tension.[22] The horizontal axis shows the current timeline of the Hong Kong protests, and the vertical axis shows the PCI-Crackdown, the counterfactual timeline leading up to the Tiananmen crackdown. Each data point in this time series gives an “as-if” date in the Tiananmen timeline to the (factual) date in the Hong Kong timeline, serving as a barometer of tension. As the PCI-Crackdown ascends toward the dashed line on June 4, 1989, the likelihood of a Tiananmen-like crackdown in Hong Kong increases.

Figure 5: PCI-Crackdown for 2019 Hong Kong protests
When interpreting the output of the PCI-Crackdown model, it is important to keep in mind that the tension generated by protests does not always increase in a linear fashion. While the level of tension in the month or so leading up to the Tiananmen crackdown was largely increasing throughout, the evolution of tension in the ongoing Hong Kong protests can and did have its ups and downs, which is what Figure 5 captures. For example, the spike of the PCI-Crackdown on August 5, 2019, when the Chinese authorities were conducting the first anti-riot drill near the Hong Kong border, reached the level of rhetoric seen on May 26, 1989—less than ten days before the Tiananmen crackdown. The tension somewhat eased off in September and October, which was picked up by the indicator as it showed less frequent movements and registered lower values. However, the relative calmness proved to be short-lived; the more recent violent confrontation between protesters and the police in November brought the indicator back to a higher level.
The Chinese government’s narrative regarding Hong Kong is also very responsive to the dynamics of U.S.-China relations. For example, on October 14, 2019, after the U.S. and China agreed to signing a “phase-one” trade deal, the indicator dropped from the previous high of May 19, 1989 to May 8, 1989, almost a month away from the June 4, 1989 crackdown. However, just three days later, it bounced back to May 16, 1989 after the U.S. House of Representatives passed the Hong Kong Human Rights and Democracy Act, a bill the Chinese government claimed interfered in its internal affairs.
Since both the Hong Kong protests and the U.S.-China trade negotiations are still ongoing, the PCI-Crackdown remains a useful way to gauge how the events will unfold.
Potential applications
The People’s Daily is by no means a unique case in which authoritarian propaganda has predictive “value.” The same method can be readily replicated on other authoritarian regimes with state-controlled media. The People’s Daily is to China as the Rodong Sinmun is to North Korea, the Granma is to Cuba, and the Nhân Dân is to Vietnam. Extending the PCI project series in this direction is part of our ongoing efforts.
In addition, the PCI algorithms are also applicable to domestic politics. Any politician or otherwise publicly accountable decision-maker may, for various reasons, find it necessary to alter their words before changing their actions. Imagine a liberal-leaning legislator who decides to support a conservative-leaning bill. Due to political pressure—be it from their legislative allies or their constituents—it may be crucial that the legislator justifies their unusual vote in advance. The PCI framework can enable us to predict changes in their actions based on changes in their words.
We leave it to future research to explore these different contexts in which our methodology can be applied.
About the Author
Julian TszKin Chan is a Managing Economist and Lead Data Scientist at Bates White Economic Consulting. Weifeng Zhong is a Senior Research Fellow at the Mercatus Center at George Mason University. Chan and Zhong are core maintainers of the Policy Change Index, a series of open-source machine learning projects. More about this line of their work can be found at: policychangeindex.org.
Endnotes
Stephen Walt, in an earlier issue of this journal, discusses this point in the context of the policy relevance of international relations scholarship. See Stephen M. Walt, “Theory and Policy in International Relations: Some Personal Reflections,” Yale Journal of International Affairs, September 2012.
While some of the mentioned characteristics apply to a few other countries, the uniqueness of this combination makes it difficult to find reference points.
Paul Collier, for example, notes that his model cannot be used to predict civil war. “[It] can tell you the sort of countries that are most at risk. But it cannot tell you whether Sierra Leone will have another civil war next year.” Paul Collier, The Bottom Billion: Why the Poorest Countries Are Failing and What Can Be Done About It (Oxford: Oxford University Press, 2008). One can see this drawback more generally, in the literature on the causes and correlates of war. The typical approach taken by most models starts with a cross-country approach and focuses on identifying the conditions that are most conducive to war. But the indicators are blunt in that they are typically measured by year, not by day or month, and they are not meant to be interpreted as predictions on any specific country in the sample. See, e.g., Nathaniel Beck, Gary King, and Langche Zeng, “Improving Quantitative Studies of International Conflict: A Conjecture,” American Political Science Review 94, no. 1 (March 2000); Scott de Marchi, Christopher Gelpi, and Jeffrey Grynaviski, “Untangling Neural Nets,” American Political Science Review 98, no. 2 (May 2004); Nathaniel Beck, Gary King, and Langche Zeng, “Theory and Evidence in International Conflict: A Response to de Marchi, Gelpi, and Grynaviski,” American Political Science Review 98, no. 2 (May 2004); Kristian Skrede Gleditsch and Michael Ward, “Forecasting Is Difficult, Especially About the Future: Using Contentious Issues to Forecast Interstate Disputes,” Journal of Peace Research 50, no. 1 (January 2013).
Communications scholars have long argued that propaganda “works.” See, e.g., Walter Lippmann, Public Opinion (New York: MacMillan Co., 1922) and Harold Lasswell, Propaganda Technique in the World War (Oxford: Knopf, 1927). In recent years, empirical studies have shown that media can indeed have a significant effect on political outcomes, especially in authoritarian or totalitarian regimes. A few examples in this literature are: Matthew Gentzkow and Jesse Shapiro, “Media, Education and Anti-Americanism in the Muslim World,” Journal of Economic Perspectives 18, no. 3 (Summer 2004); David Yanagizawa-Drott, “Propaganda and Conflict: Evidence from the Rwandan Genocide,” The Quarterly Journal of Economics 129, no. 4 (November 2014); Maja Adena, Ruben Enikolopov, Maria Petrova, Veronica Santarosa, and Ekaterina Zhuravskaya, “Radio and the Rise of the Nazis in Prewar Germany,” The Quarterly Journal of Economics 130, no. 4 (November 2015).
Alex Inkeles, Public Opinion in Soviet Russia: A Study in Mass Persuasion (Cambridge: Harvard University Press, 1950), p. 17.
Ibid., p. 162.
Ibid., p. 18.
Anne-Marie Brady, Marketing Dictatorship: Propaganda and Thought Work in Contemporary China (Lanham: Rowman & Littlefield, 2008); David Shambaugh, “China’s Propaganda System: Institutions, Processes and Efficacy,” The China Journal 57 (January 2007); David Shambaugh, China’s Communist Party: Atrophy and Adaptation (University of California Press, 2008).
“Xi Jinping’s News Alert: Chinese Media Must Serve the Party,” The New York Times (February 22, 2016).
One may wonder if the Chinese government uses propaganda outlets to test messages—that is, experimenting with different policy messages to determine their effect on the public. Such experimentation has been observed in other circumstances, such as Russia reportedly testing new disinformation tactics in a Facebook campaign in parts of Africa. (See Davey Alba and Sheera Frenkel, “Russia Tests New Disinformation Tactics in Africa to Expand Influence,” The New York Times (October 30, 2019).) We are not aware of such message experimentation in The People’s Daily, likely because it is too prominent for running experiments. Testing in Chinese local newspapers, however, is certainly plausible.
This section draws from our paper “Reading China: Predicting Policy Change with Machine Learning,” AEI Economics Working Paper No. 2018-11 (2019).
The policy indicator closest to what we focus on is the economic policy uncertainty index pioneered by Scott Baker, Nicholas Bloom and Steven Davis, “Measuring Economic Policy Uncertainty,” The Quarterly Journal of Economics 131, no. 4 (November 2016). An implementation of their framework in the context of China is done by Yun Huang and Paul Luk, “Measuring Economic Policy Uncertainty in China,” working paper (2018). However, there is a clear distinction between policy priorities and policy uncertainty; the realization of uncertainty may imply a change (in priorities), but priorities, if well-defined and strictly held, contain little uncertainty.
The most up-to-date PCI-China is available at: policychangeindex.org.
In the machine learning literature, this approach is called supervised learning, where the algorithm is trained under the “supervision” of known examples provided by researchers (e.g., front-page versus non-front-page articles) and is designed to learn the patterns that set them apart.
The front-page classifier is built using Gated Recurrent Unit, a type of neural network model specialized in modeling text data. For more details, see Kyunghyun Cho, Bart van Merrienboer, Caglar Gulcehre, Dzmitry Bahdanau, Fethi Bougares, Holger Schwenk, and Yoshua Bengio, “Learning Phrase Representations using RNN Encoder-Decoder for Statistical Machine Translation,” arXiv:1406.1078 (September 2014).
The indicator is plotted up to the third quarter of 2019. For future quarterly updates, see: policychangeindex.org. For details of the labeled events, see Appendix A.1 to our paper “Reading China: Predicting Policy Change with Machine Learning,” AEI Economics Working Paper No. 2018-11 (2019).
Here, we use the words “typically precedes” because, in neural network models, a formal statistical inference procedure remains an open question in the literature. We leave that issue to future research.
For details, see Section 5.2 of our paper “Reading China: Predicting Policy Change with Machine Learning,” AEI Economics Working Paper No. 2018-11 (2019).
See our articles “China’s Next Policy Change: Not What President Trump Hopes For,” AEIdeas (January 15, 2019) and “How China’s State-Run Media Foretold the Trade War Stand-off,” The Bridge (July 16, 2019).
This section draws from our paper “Predicting Authoritarian Crackdowns: A Machine Learning Approach,” Mercatus Working Paper (2020).
The Tiananmen protests started on April 15, 1989, after the death of Hu Yaobang, a pro-reform Chinese leader. The protesters sought democracy, freedom of speech, and greater accountability of the government, among other things. It ended on June 4, 1989, when the government sent troops to Tiananmen Square to suppress the protests.
The indicator is plotted up to December 8, 2019. For future daily updates, see: policychangeindex.org.